For the past year or so I’ve been working with Aidan Moseby, Clive Gilman from DCA and my colleague Jon Rogers on a small project for New Media Scotland Alt-w fund. We were one of a number of projects comissioned to complement Ginsberg, a newly-launched app designed to improve health and wellbeing through mood-tracking and self-reflection.
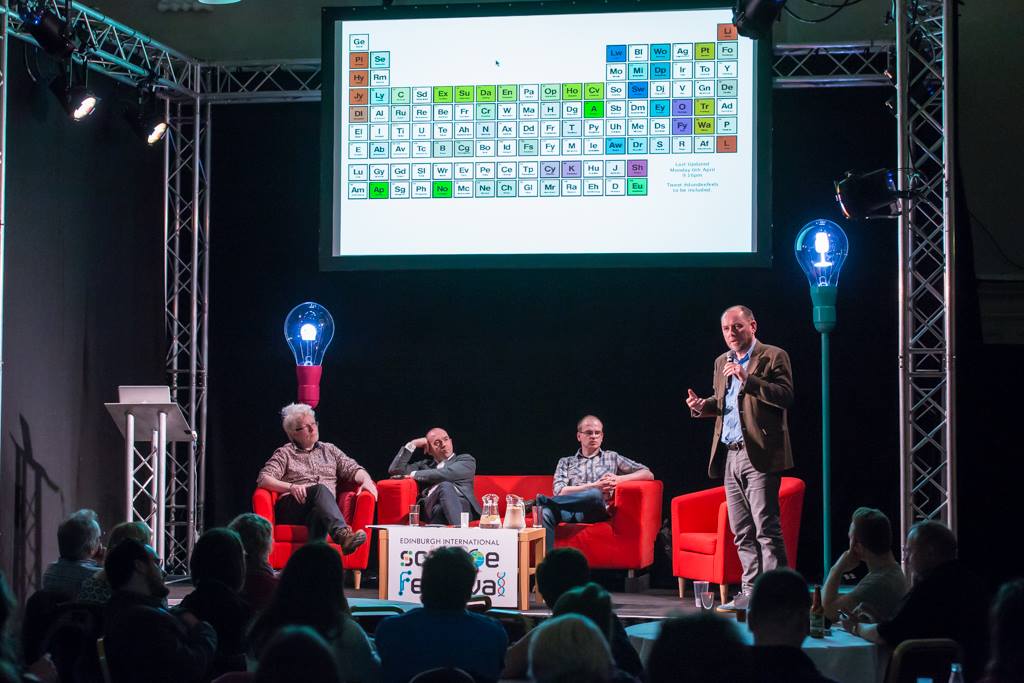
A few weeks ago we officially launched Sagacity at Edinburgh Science Festival’s LateLab, alongside Ginsberg itself and a number of other Alt-w projects. Where Ginsberg prompts reflection on the self, Sagacity is a visualisation designed to prompt reflection on the city. Cities generate a lot of existing content that we can use: social media, news, traffic, weather, so Sagacity aims to scape existing data generated by and about Dundee and reflect this back in an engaging way.
Visualising the City
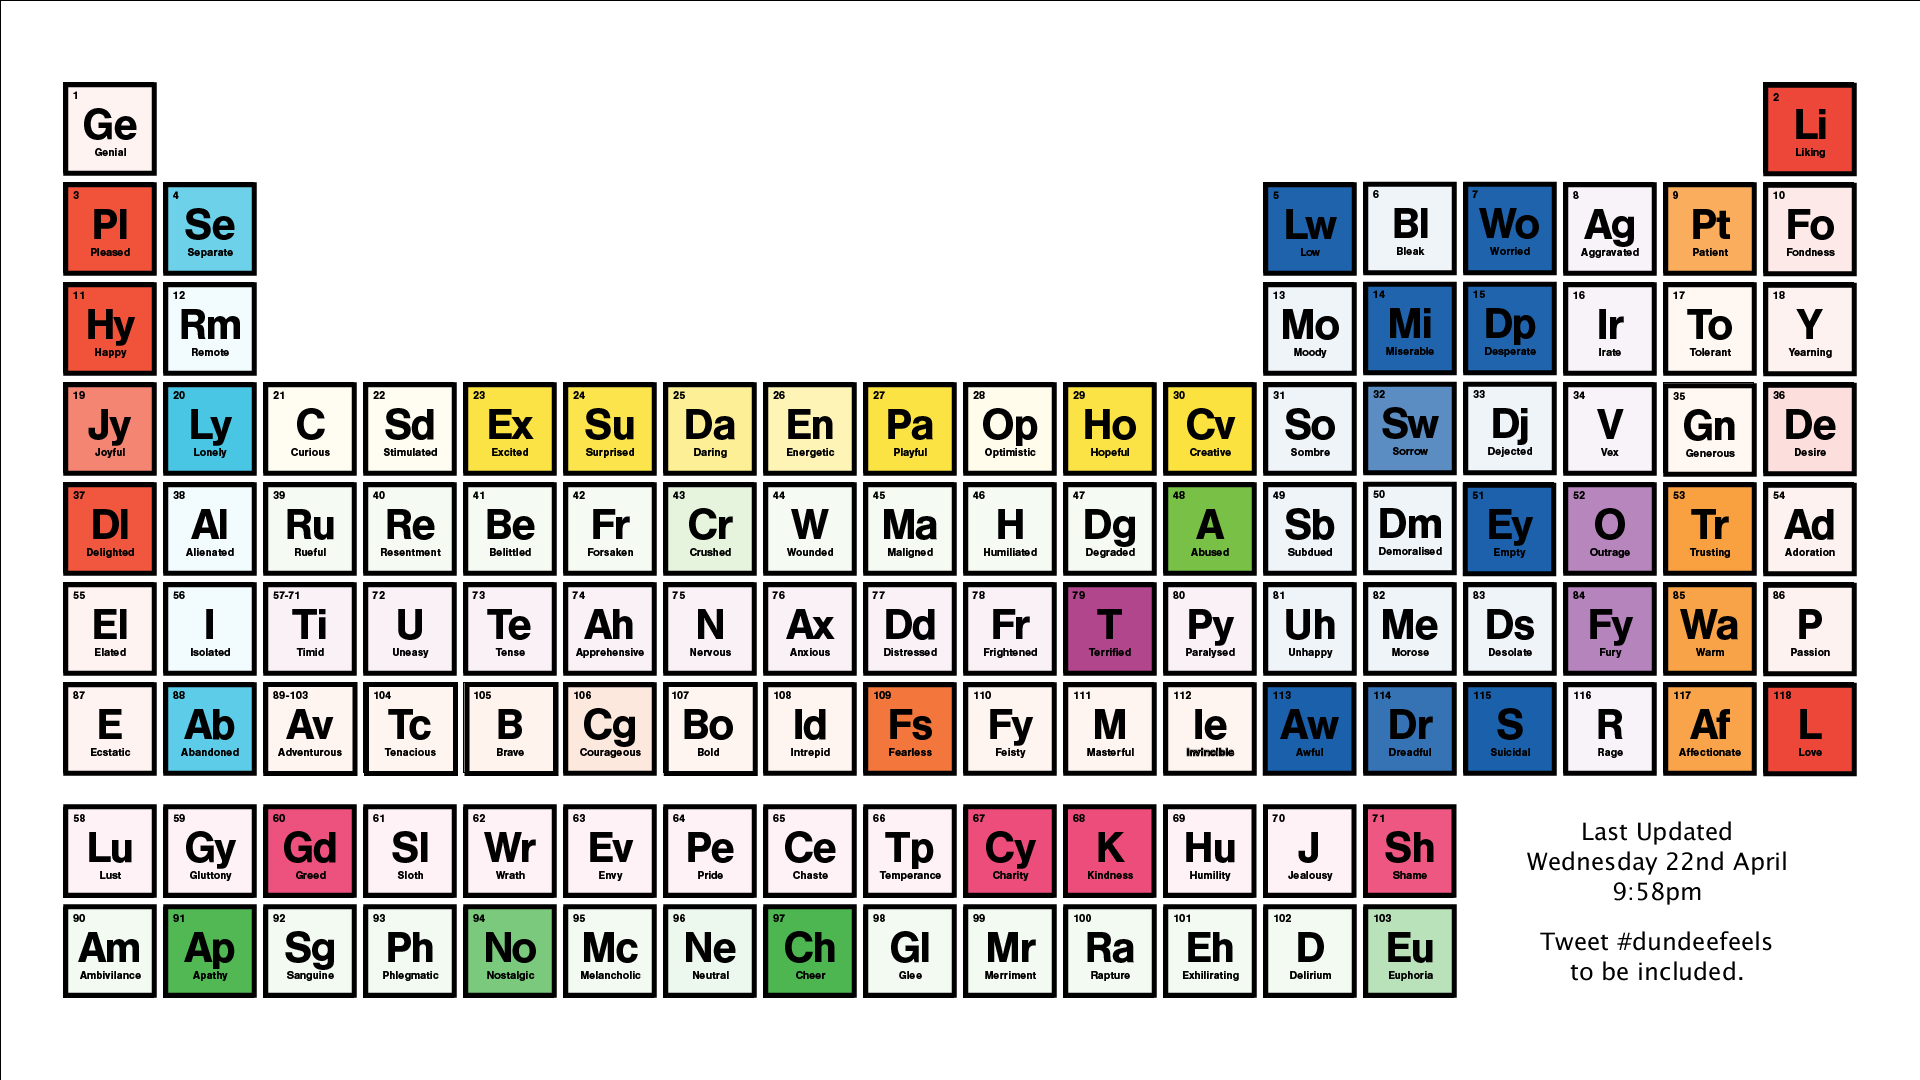
A lot of the ideas we threw around for visualising the city used existing systems of categorisations as metaphors—colours and weather, for example, both of which have an existing association with mood. Ultimately Aidan settled on a Periodic Table of Emotions—we were developing this round about the time that Breaking Bad ended, so the symbols had a kind of currency that they had previously only enjoyed at chemistry conventions.
He devised a table where similar emotions are grouped and ordered by intensity, much like the table of elements (see below). For example, the left-hand column collections various forms of happiness (genial, pleased, happy, joyful, delighted, elated and ecstatic), while the second collects forms of loneliness (separate, remote, lonely, alienated, isolated, abandoned).
Next, we need to automatically grab instances of these words being generated in Dundee. This turns out to be harder than you might expect.
Bringing Sagacity to Life
After exploring a number of data sources, we turned to Twitter as the most appropriate option: where else do people broadcast their emotions to the world? But while Twitter has a geo-tagging feature, nobody turns it on. Searching for the term ‘Dundee’ is no good either: in the couple of weeks I was testing that approach, speculation about Manchester United buying a Dundee player, news that One Direction were delivering toys to Ninewells Hospital and a re-run of Crocodile Dundee 2 all overwhelmed the data. In the end, we scraped tweets from a pre-defined panel of known Dundee tweeters, but also allowed people to add themselves to the panel by tweeting on the #dundeefeels hashtag. This is obviously not very scientific, but our hope is that the panel will grow larger and more representative over time.
Next, we need to turn our content into emotions. After exploring a number of sentiment analysis tools, it was clear that even categorising tweets into positive and negative was not really achievable. Instead, we looked for instances of the words in the table: when a word is used, the box lights up, and then fades out slowly over time. The effect is a constantly shifting pattern of colours and intensities. I had hoped that it might be a bit more dynamic, but this will improve as the panel (and consequently the dataset) grows. Playing back at high speed is also pretty captivating!
Coming Next
The plan was always to exhibit Sagacity over a longer period, supporting the kind of reflection we had intended to provoke. We will hopefully be exhibiting Sagacity in Dundee soon, as well as at a number of one-off events where the visualisation can reflect the mood of event attendees rather than the entire city.
Update: Since I wrote this I learned that you can pull tweets from a geographic area that aren’t geotagged, as Twitter uses profile data to make a best guess, but the API has been broken since November. Hoping to play around with this in the future.
Leave a Reply